Metrics and Targets
| Classification | Metrics | Latest Results | Targets | |
|---|---|---|---|---|
| Reduce financed emissions | GHG emissions from the investment and loan portfolio | FY2030 Interim targets toward net zero in 2050 | ||
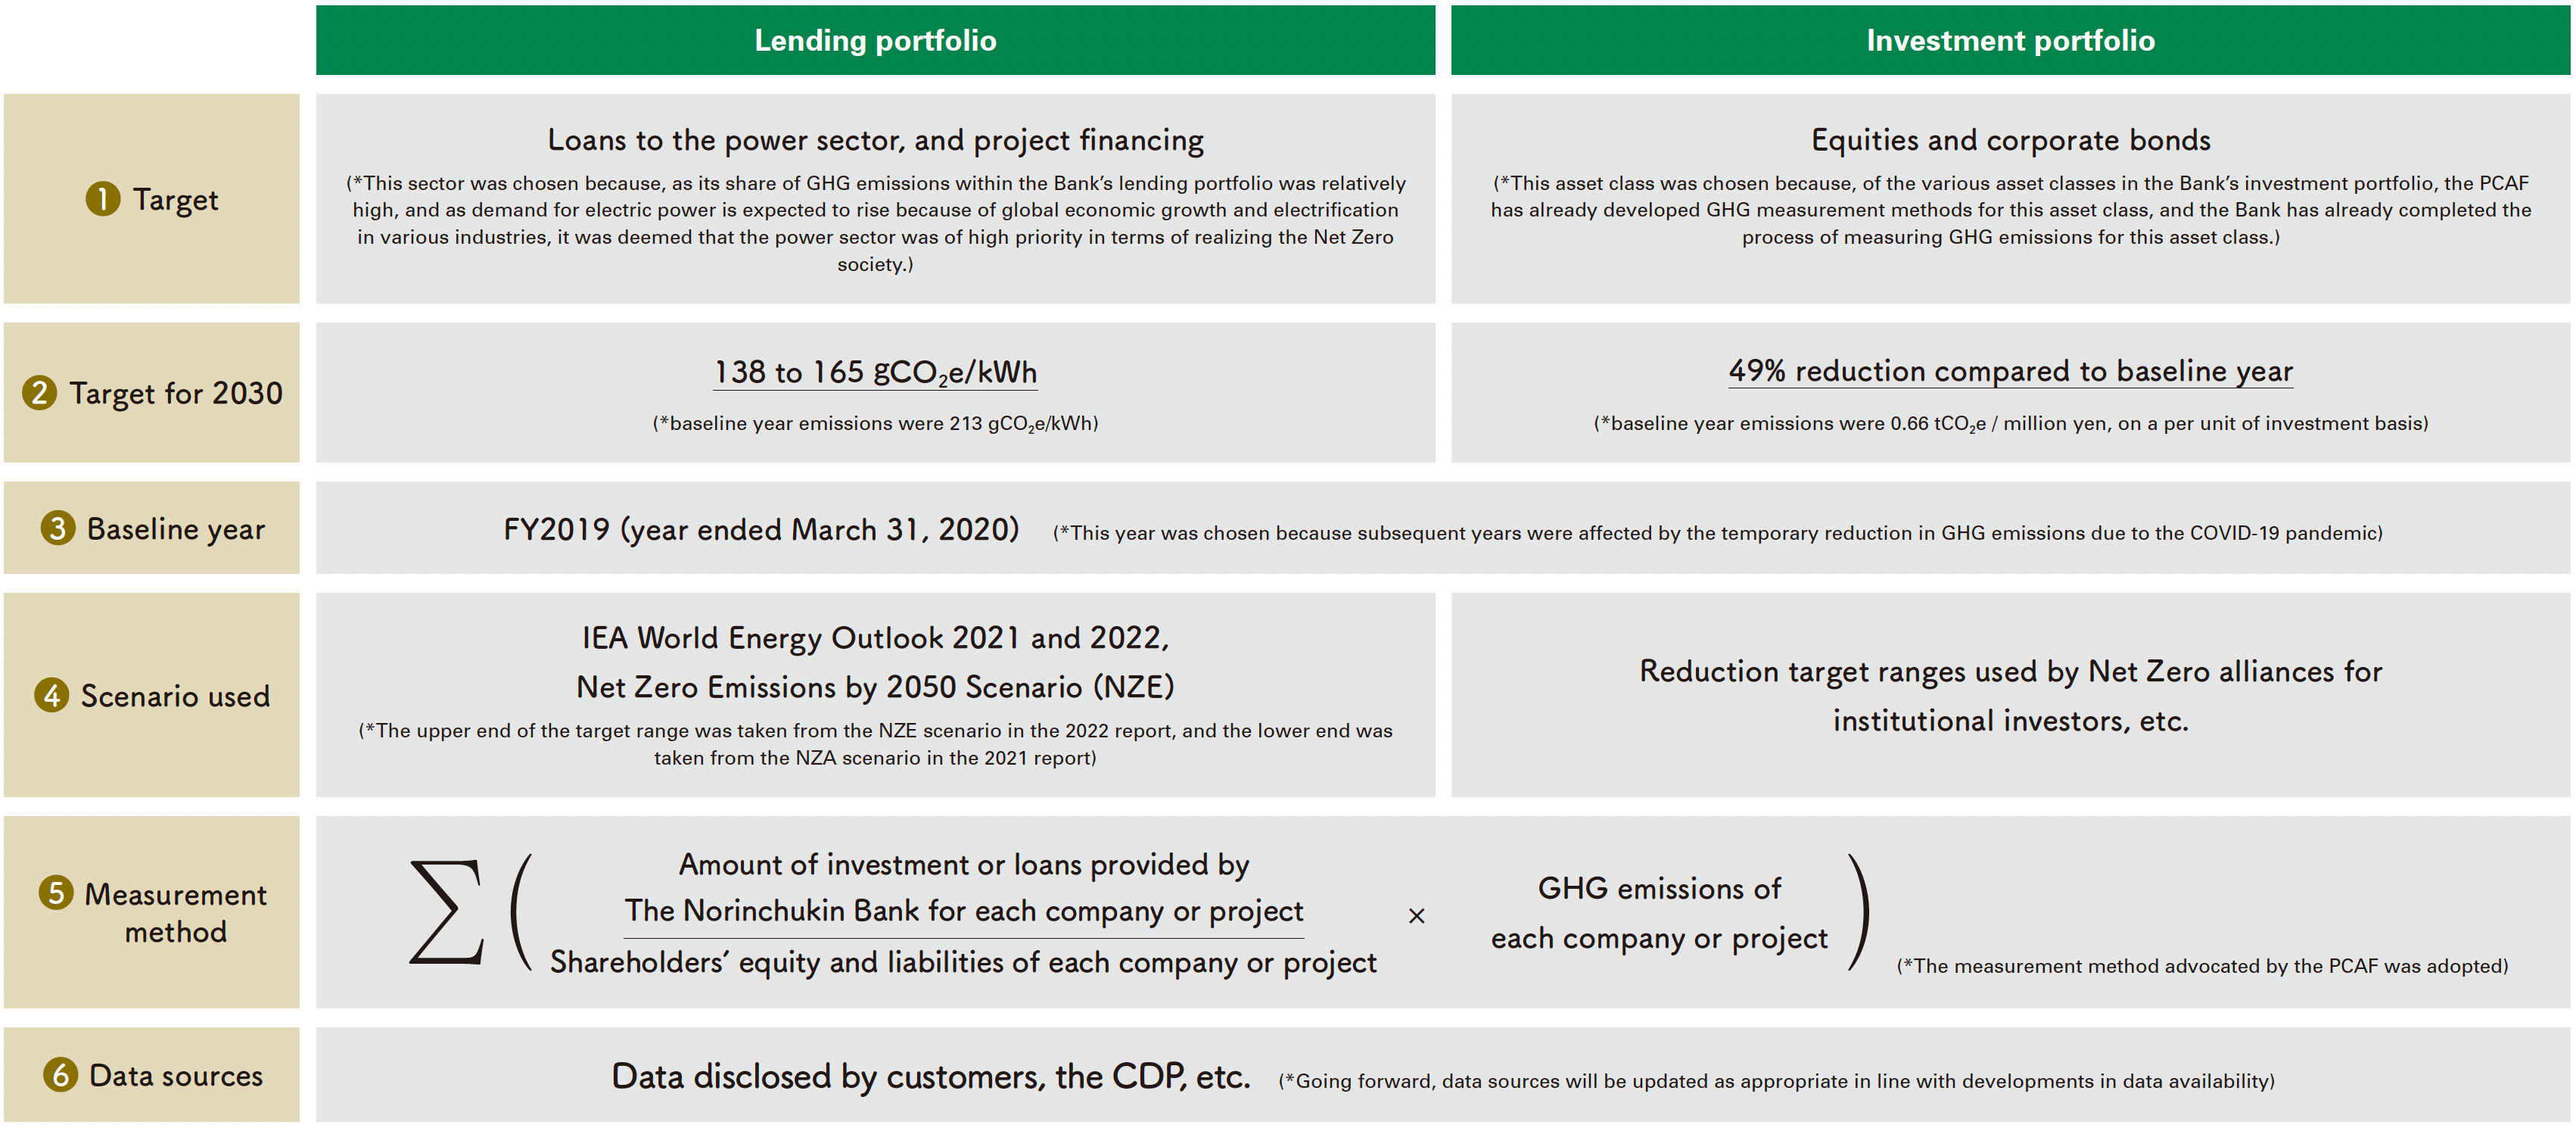
| [Lending] Power Sector Base year: FY2019 results 213gCO₂e/kWh |
FY2020* 217gCO₂e/kWh |
138 to 165gCO₂e/kWh | ||
| [Investment] Emissions per unit of investment basis (stocks and bonds) Base year: FY2019 results 0.66tCO₂e/million yen |
FY2020 0.55tCO₂e/million yen -17% compared to FY 2019 |
-49% compared to FY2019 | ||
| Secure the amount of the forest carbon sink, together with JForest members | FY2021 6.12 million tCO₂ |
9 million tCO₂/year, as of FY2030 | ||
| GHG Emissions by the Bank Itself | FY2021 19,849tCO₂ |
Net zero by FY2030 | ||
| Encourage sustainable business | New sustainable finance | FY2021 to FY2022 (Cumulative) ¥4.4 trillion |
¥10 trillion by FY2030 | |
| Strengthening the risk management system | Reduction of outstanding investment and loan for coal-fired thermal power | End of FY2022 ¥36.6 billion |
Zero by 2040 | |
*The increase compared to fiscal 2019 is due to an increase in the number of clients classified in the electricity sector. This increase in clients resulted from system registration maintenance, in addition to increased exposure from the spread of COVID-19.
Reducing Financed Emissions –Approach to Setting the Interim Targets
Basic Approach
- The Bank is committed to achieving Net Zero GHG emissions by 2050 for its investes and borrowers through its signature on the Net Zero Banking Alliance (NZBA).
- In accordance with the NZBA framework, we have set interim targets for 2030 for the electricity sector of our loan portfolio. We will continue to set targets in turn for the nine carbon-intensive sectors (includes electricity as well as oil and gas, steel, coal, transportation, real estate, agriculture, cement, and aluminum) specified in the framework.
- In addition to described above, considering the percentage of investment assets in our investment and loan portfolio is vital. the Bank will additionally set interim targets for the investment portfolio (this time covering equities and corporate bonds) for fiscal 2030 by taking the Net Zero Initiative framework for institutional investors into consideration. Going forward, the Bank will continue to expand the investment asset classes covered by these targets in light of developments in GHG measurement practices at the Bank.
Click to enlarge
Calculating Financed Emissions
The Bank recognizes that measuring and reducing the indirect GHG emissions (Financed Emissions, Scope 3 Category 15) from investment and loan is an important issue, as these emissions account for a large proportion of the total GHG emissions of financial institutions.
In fiscal 2022, we made a provisional estimate of GHG emissions to better understand the current situation of GHG emissions, targeting a broad range of asset classes in our investment and finance portfolios. The estimate covered loans, corporate bonds and stocks intended for industrial corporations (including matters for investment and finance in the form of any funds).
Methodology to measure financed emissions
In the provisional estimate of GHG emissions, we referred to the measuring methodology proposed by the PCAF. The Bank became a member of the PCAF in March 2022. In the future, the Bank will further improve initiatives related to the measurement and disclosure of GHG emissions of its investment and financing portfolios by leveraging the PCAF’s knowledge and databases.
| Target Assets | These assets include loans for business corporation, bonds, and stocks (including fund investment and finance projects* 1) and project financing (for power generation).
|
|---|---|
| Formula | 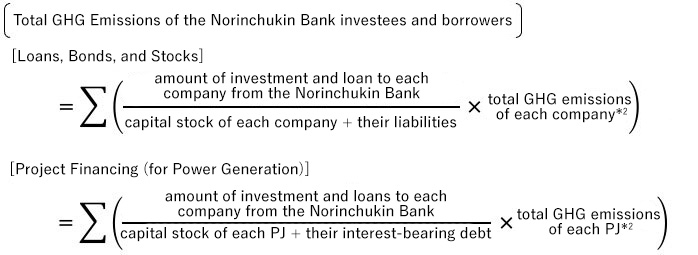
|
| Target Year | FY2020 Norinchukin Bank investment and loan: Balance as of March 2021 Financial and emissions data: The latest available data within three years of March 31, 2021 |
| Source of Emissions Data |
|
Results
Assets shown on the left amounted to 22.1 million tCO₂e of measured GHG emissions. The following is a breakdown of sectors recommended to be disclosed according to the TCFD.
| Sector | GHG Emissions (Million t CO₂e) |
Economic Emissions Intensity (t CO₂e/100 million yen) |
Measurable Exposure (trillions of yen) | Unmeasurable Exposure (trillions of yen) |
|
|---|---|---|---|---|---|
| TCFD Recommendations Sector |
Energy (Including Electric Utilities) |
7.5 | 467 | 1.6 | 0.05 |
| Transportation | 2.1 | 100 | 2.1 | 0.03 | |
| Materials and Buildings | 8.0 | 173 | 4.6 | 0.11 | |
| Agriculture, Food, and Forest Products | 2.1 | 112 | 1.8 | 0.02 | |
| Other | Other | 2.4 | 21 | 11.3 | 1.46 |
| Total | 22.1 | 103 | 21.5 | 1.66 | |
- *This table is based on current measurements. Figures are subject to change as measurements are refined going forward. No third-party certification has been obtained for the measurements in this table.
Supplementary Information on Our Measurements
- The above measurements are based on on-balance sheet assets of the Bank for business corporations. For fund investment and finance projects, we not only include look-through cases where individual companies can be identified when calculating risk assets for Basel Accord-related ratios, but we also include non-look-through assets in PE funds in our measurementsby correcting data.
- This fiscal year, we began measuring project financing (for power generation) and PE funds (non-look-though assets) in accordance with the PCAF standards. These measurements amounted to ¥ 0.7 trillion and ¥0.1 trillion, respectively, and are included in the measurable exposure above.
- We calculate investment and loan for group finance and captive finance corporations as financial exposure to the parent companies since we measure emissions that reflect actual figures as much as possible.
- Unmeasurable exposure in the above table mainly resulted from a lack of financial data.
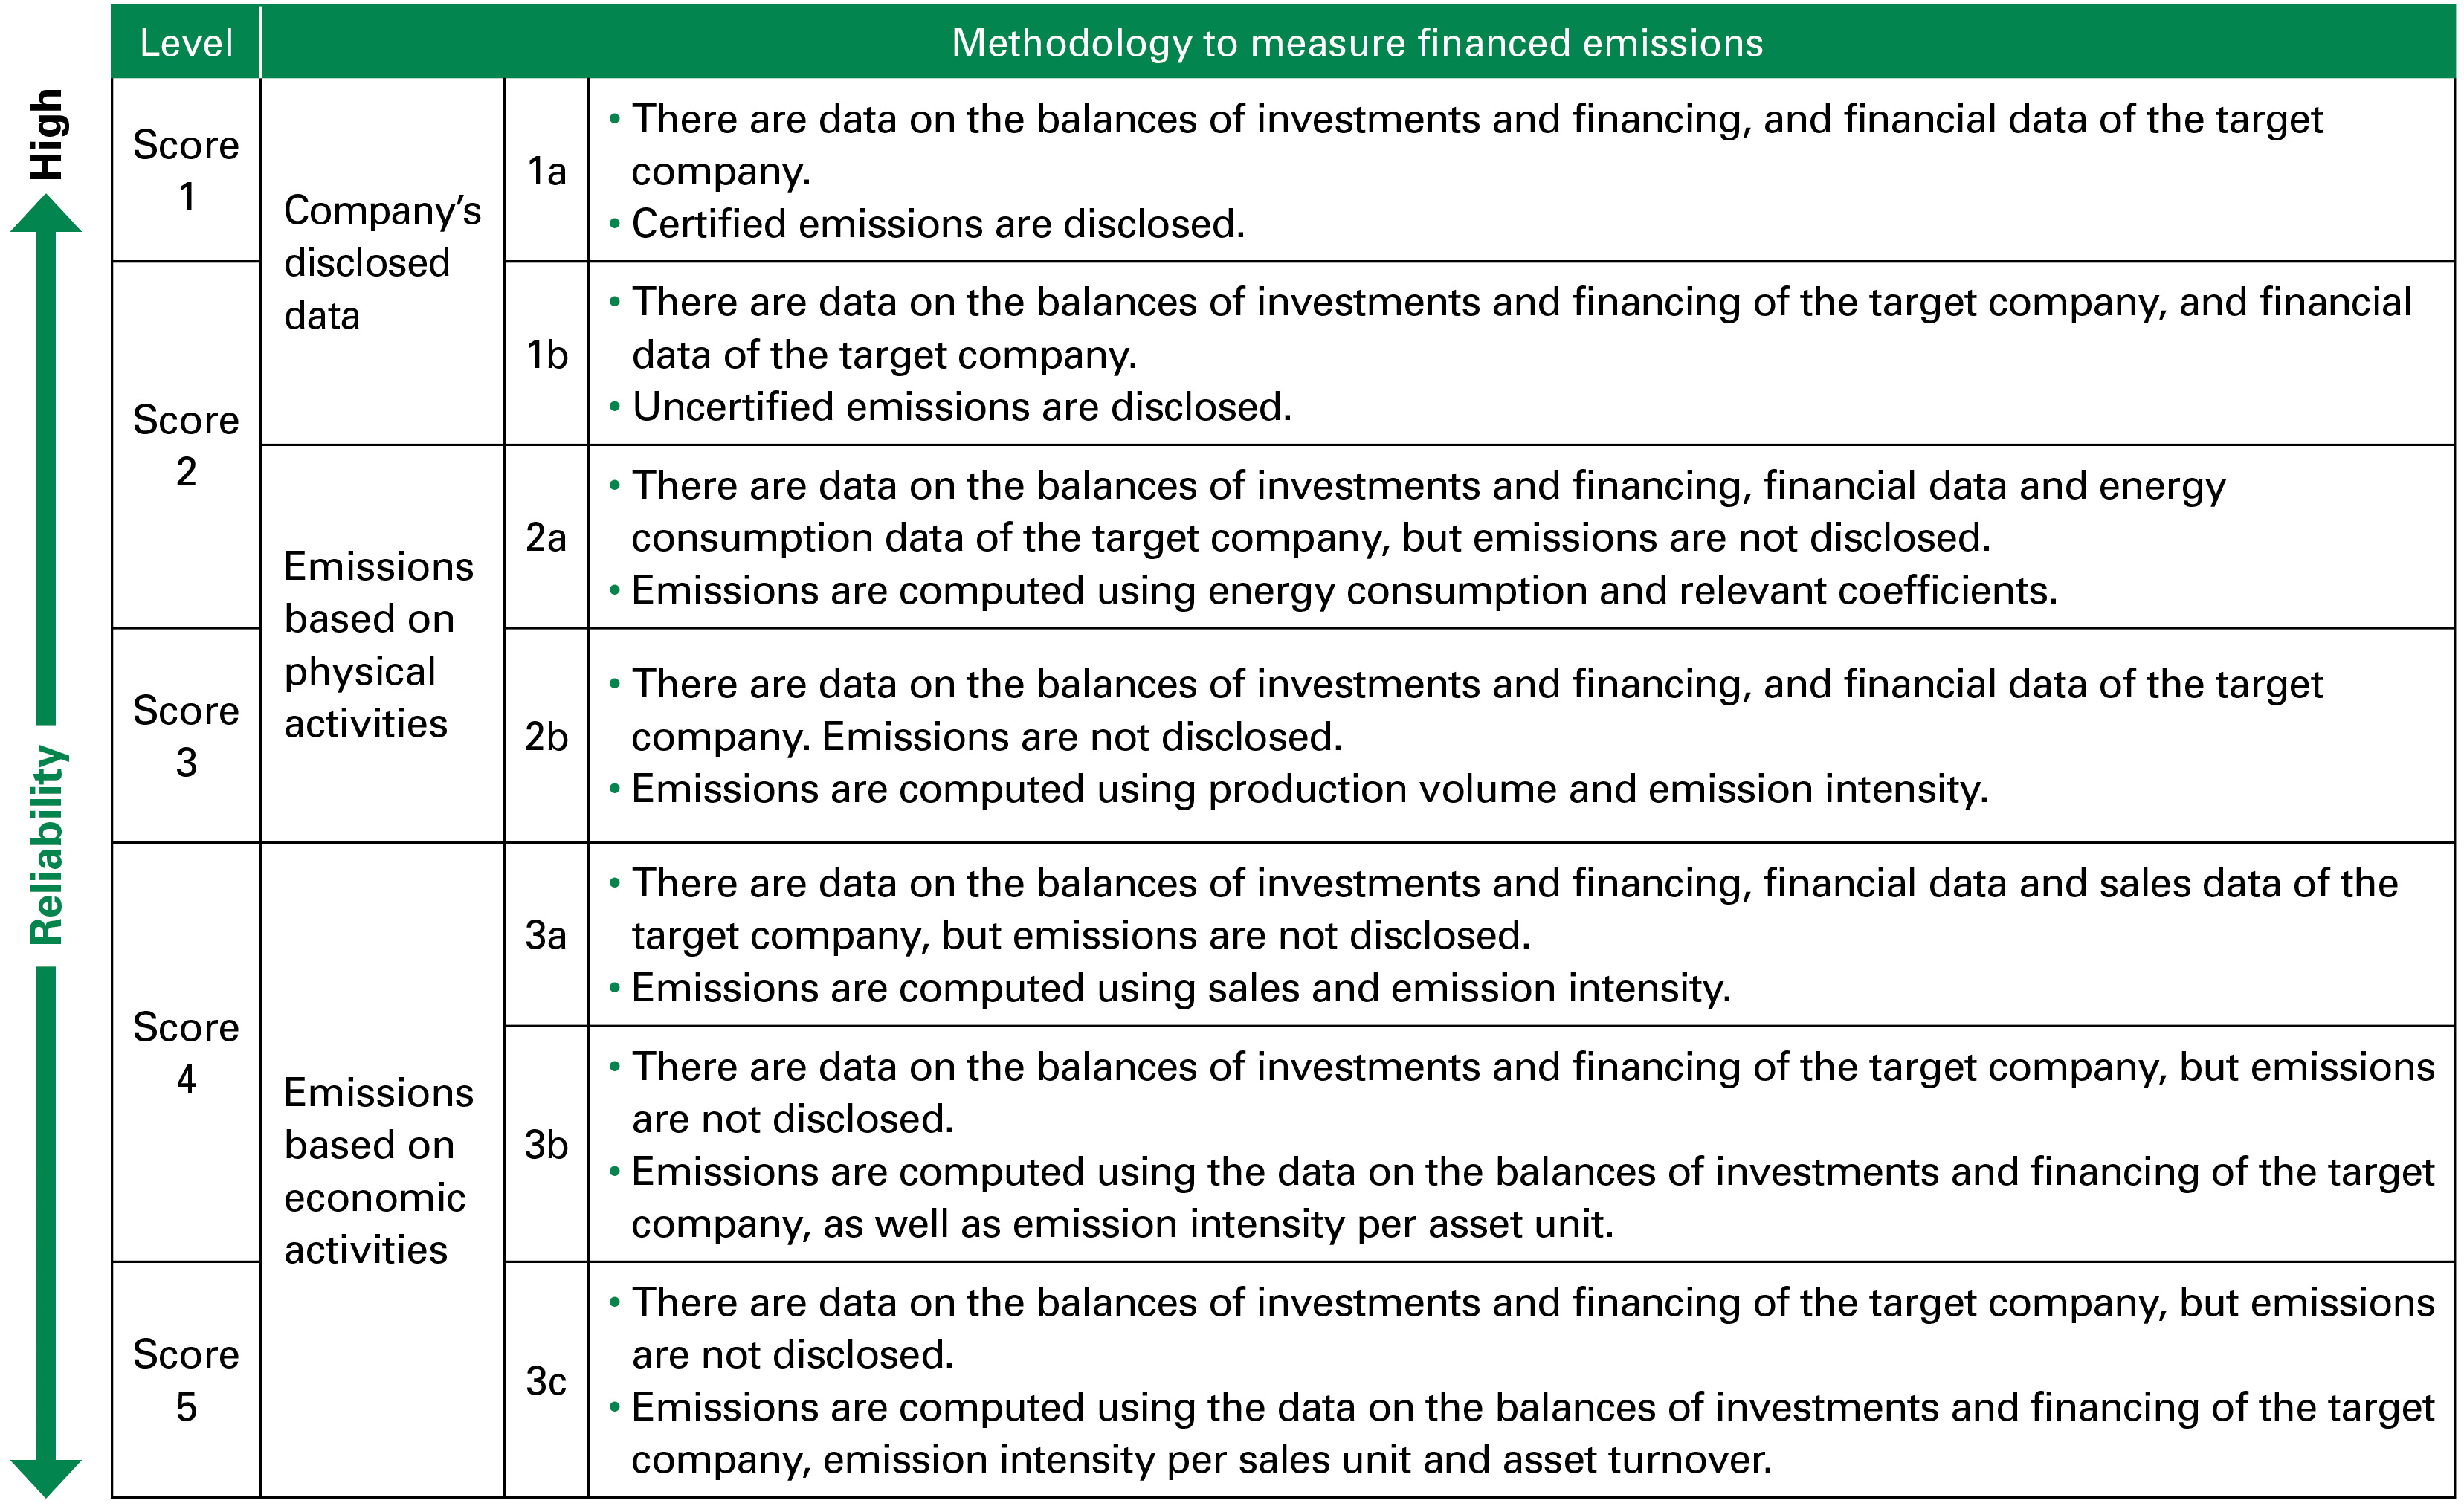
Data Quality Score Calculation
- The PCAF established the data quality score to evaluate the quality of estimated emissions and recommends calculating relevant scores. These scores are presented in the following table.
- The status of emissions data disclosure at each of the companies of our investees and borrowers varies widely. For those that did not disclose their emissions data, we estimated their economic activity-based emissions by using estimated data from an external information vendor (Trucost). We additionally used sales and emissions intensity data from the companies as supplementary information.
- In addition to using Trucost data, we began using the CDP database to enhance our calculation logic to determine if external certification was present based on individual company responses to a CDP questionnaire. As a result, we successfully granted them a score of 1. The calculated data quality score for current measurements is approximately 2.48. We will continue to improve this score.
Carbon-Related Assets
The Bank expanded the disclosure sector to reflect the revised definition of carbon-related assets based on the October 2021 revision of the TCFD recommendations. As of March 31, 2023, carbon-related asset exposure (loans) as of totaled ¥7.4 trillion, and occupy 43.9% to total exposure (loans) of all sectors. The Bank established its 2030 interim GHG emission reduction targets for the electricity sector in accordance with the NZBA framework, and will gradually establish targets for other carbon-intensive sectors going forward. We will take measures to achieve our target of Net Zero greenhouse gas emissions by 2050, from our investment and loan portfolio, and appropriately monitor relevant exposure.
March 31, 2023 Exposure to Carbon-Related Assets*
| Sector | Exp (Trillion yen) | Concentration Ratio |
|---|---|---|
| Electric Utilities | 0.8 | 4.6% |
| Oil and Gas | 0.4 | 2.5% |
| Coal | 0.0 | 0.0% |
| Energy Subtotal | 1.2 | 7.2% |
| Air Freight | 0.0 | 0.2% |
| Passenger Air Transportation | 0.0 | 0.3% |
| Maritime Transportation | 0.1 | 0.8% |
| Rail Transportation | 0.4 | 2.1% |
| Trucking Services | 0.0 | 0.3% |
| Automotive and Components | 0.8 | 4.6% |
| Transportation Subtotal | 1.4 | 8.3% |
| Metals and Mining | 0.3 | 1.8% |
| Chemicals | 0.6 | 3.7% |
| Construction Materials | 0.1 | 0.5% |
| Capital Goods | 1.9 | 11.5% |
| Real Estate Management and Development | 1.0 | 6.1% |
| Materials and Buildings Subtotal | 4.0 | 23.6% |
| Beverages | 0.1 | 0.7% |
| Agriculture | 0.1 | 0.6% |
| Packed Food and Meats | 0.4 | 2.2% |
| Paper and Forest Products | 0.2 | 1.4% |
| Agriculture, Food and Forest Products Subtotal | 0.8 | 4.8% |
| Total of Aforementioned Sectors | 7.4 | 43.9% |
| Total for All Sectors | 16.9 | 100% |
*Covers non-consolidated loans for the Bank.
- Sustainability
- Sustainability Management
- Our Purpose and Vision
- Medium- to Long-Term Goals and Initiatives
- Milestones of Sustainability Management
- Philosophies and Policies
- Sustainability Promotion Structure
- Sustainability Advisory Board
- Identifying Sustainability Issues
- Stakeholder Engagement
- Participation in Initiatives
- Sustainable Finance
- Initiatives to Manage Environmental and Social Risks
- Agriculture, Fishery, Forestry Industries, and Regions
- Environment
- Social
- Governance
- Report/Index